Graphy in Action: Percentage, BMI, and EMI Visualized
Walk through three real calculation examples — percentage discount, BMI health range, and EMI loan breakdown — each rendered through Graphy's visual engine.
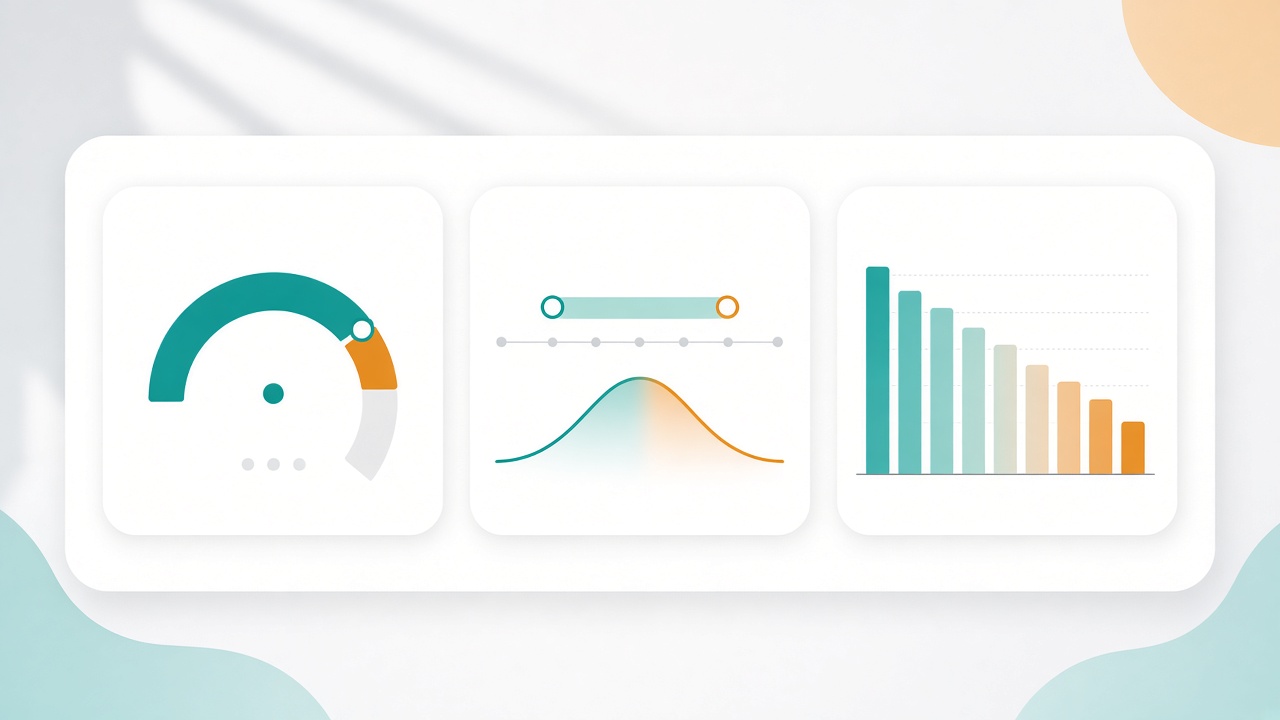
Three Calculations, Three Visual Stories
Theory is useful, but Graphy truly shines when you see it applied to real problems. Below are three worked examples — the kind you will encounter daily — each shown through Graphy's visual renderers. These represent the MVP showcase calculators: Percentage, BMI, and EMI.
Example 1: Percentage Calculator — "What is 15% off ₹2,400?"
You are shopping and see a 15% discount on an item priced at ₹2,400. Instead of mental math, Graphy Calculator computes the discount and shows the full breakdown.
| Input | Value |
|---|---|
| Original Price | ₹2,400 |
| Discount Rate | 15% |
| Discount Amount | ₹360 |
| Final Price | ₹2,040 |
The flowchart makes it obvious: original price flows through the discount rate to produce savings, then subtracts to the final amount. No hidden steps.
Example 2: BMI Calculator — "Am I in a healthy range?"
Body Mass Index combines weight and height into a single health indicator. Graphy Calculator computes BMI and uses the Gauge renderer to show exactly where you fall on the WHO scale.
| Input | Value |
|---|---|
| Weight | 72 kg |
| Height | 175 cm (1.75 m) |
| Formula | BMI = weight ÷ height² |
| Result | 23.5 (Normal) |
Example 3: EMI Calculator — "What will my home loan cost?"
Equated Monthly Installment (EMI) is one of the most complex everyday calculations. Graphy Calculator's EMI tool computes the monthly payment and uses bar charts to reveal how much goes to principal versus interest over the loan tenure.
| Input | Value |
|---|---|
| Loan Amount | ₹25,00,000 |
| Interest Rate | 8.5% per annum |
| Tenure | 20 years (240 months) |
| Monthly EMI | ₹21,698 |
| Total Interest | ₹27,07,520 |
| Total Payment | ₹52,07,520 |
The bar chart instantly reveals a sobering truth: over 20 years at 8.5%, you pay more in interest than the original loan amount. Graphy makes this visible — not buried in a number you might ignore.
Unit Conversion with Graphy Blocks
Graphy Calculator preserves the full unit conversion experience from its predecessor. Converting units generates the same instant results, now with optional Graphy Blocks showing the conversion factor applied step by step.
The Graphy Difference
These three examples — percentage, BMI, and EMI — represent the MVP showcase of Graphy Calculator. Each exercises a different renderer: flowchart for sequential logic, gauge for bounded ranges, and bar charts for comparative breakdowns. Together, they prove the architecture: one calculation engine, many visual stories.
Experience Graphy Yourself
Download Graphy Calculator and try these calculations with live Graphy visualizations.
Get it on Google Play StoreGraphy Examples FAQs
| Question | Answer |
|---|---|
| Can I switch renderers on the same calculation? | Yes. Flowchart, blocks, gauge, and charts all consume the same result without recalculating. |
| Does Graphy work for unit conversions? | Yes. Length, temperature, weight, and other conversions show the factor and formula in Graphy Blocks. |
| Which calculators have Graphy first? | Percentage, BMI, and EMI are the MVP showcase. Flowchart is available as fallback for all calculators. |
| Is Graphy required to use the app? | No. Graphy is optional. Your calculator and converter work exactly as fast without opening Graphy. |

Master Graphy Calculator
Experience the best of productivity with our premium Android application.